Edition 57
How to Determine Element Locators For Mobile Web and Hybrid Apps
One of the prime problems facing many automation engineers is how to start testing a new app. Often you're just given a build of the app and a set of user flows to create automated test scenarios for--no specific instructions from the developers on how individual elements might be accessed from automation. The question becomes, how do you turn UI components on the screen into Appium's locator strategies? I'm sure many of you have used the wonderful Appium Desktop as a tool for inspecting your native mobile applications. Appium Desktop's Inspector has a nice point-and-click interface you can use to get information about on-screen elements, including suggested locator strategies and selectors. More on that, and other tools for inspecting native apps, in a future edition!
For now, outside the world of native apps, the picture gets more complicated. What if you have been asked to automate a web app using mobile Safari or Chrome? Or what if your app is a hybrid app? How do you know how to find the web elements inside the app's webview? If you're familiar with Selenium, you might have started looking for some "developer tools" option in Safari or Chrome on your mobile device, only to be left empty-handed. The trick is to mix in the desktop versions of those browsers on your computer!
Inspecting Mobile Safari and Hybrid Apps on iOS
If you're running an iOS simulator with Safari open, and have navigated to the web page you want to automate, inspecting is as easy as opening up the desktop version of Safari, and going to the "Develop" menu in the menu bar:

(Don't see the Develop menu? Go to Safari's preferences, then the "Advanced" tab, and make sure "Show Develop menu in menu bar" is checked)
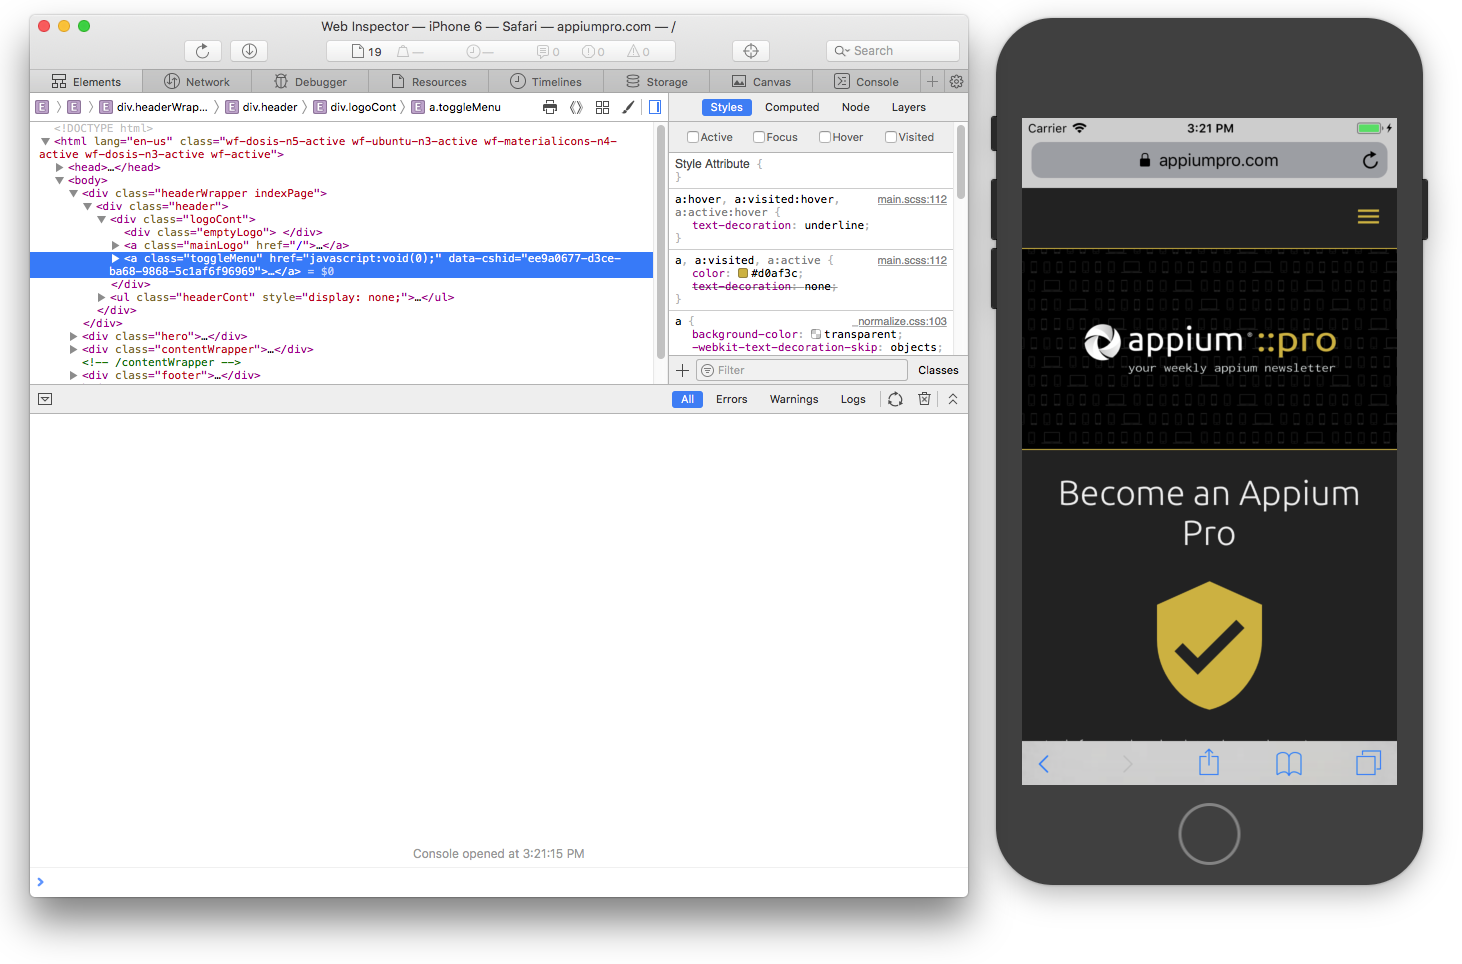
From that menu, you should see a new entry in the list of devices, reflecting the open simulator. Navigating into that menu and clicking on the appropriate website will pop up an inspector window for you:

You can now do everything you would normally do in Safari's developer tools, including exploring the HTML hierarchy (complete with colored rectangles being drawn over the corresponding elements in the simulator)! You will, of course, need to know how to turn this information into Appium locators / selectors. For example, in the image above, I've selected the menu element for the mobile version of the Appium Pro website. It happens to have a unique class, so I could find this element with a simple driver.findElement(By.cssSelector(".toggleMenu")).
(If you're brand new to web development, it's worth getting familiar with reading HTML, since that is how you'll know which locator strategies can be used to find an element, and the particular selector that will do the trick).
If you're on a real device, you'll need to open up the Advanced settings menu under the Safari preferences, and make sure that "Web Inspector" is turned on. Otherwise, you won't see your device in the Develop menu.
The good news is that if you're running a hybrid app, this same strategy should work without any additional setup--you'll simply see your webview as one of the inspectable pages in the Develop menu!
Inspecting Mobile Chrome
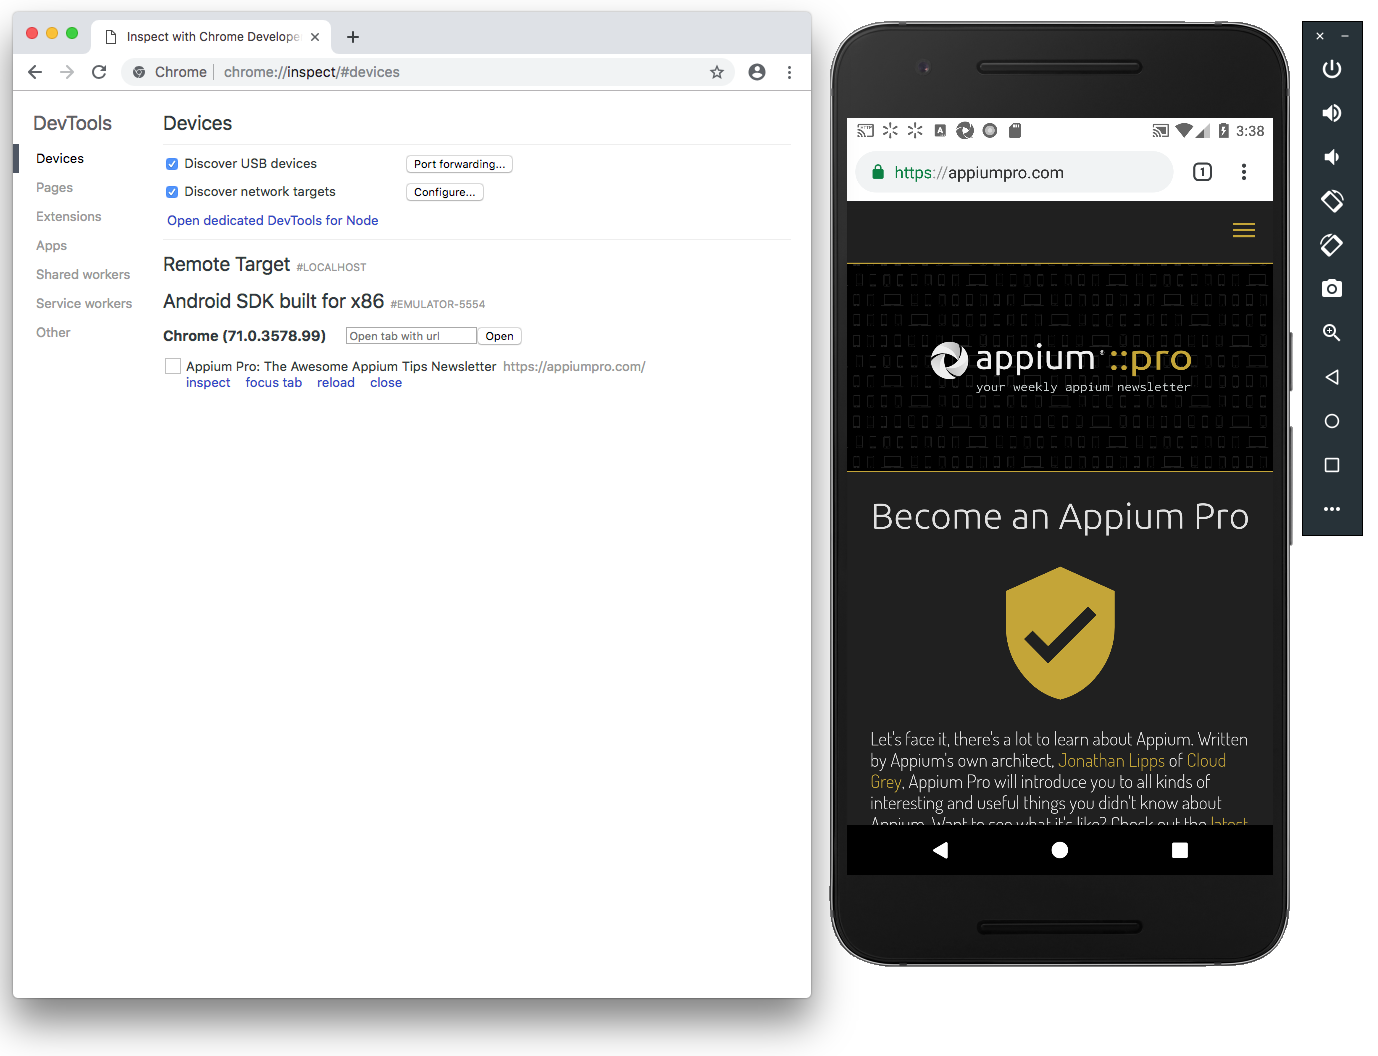
We can employ a similar strategy for Chrome, though in my opinion the experience is not quite as seamless. Again, the first thing you'll do is load up your page in the Chrome browser on your emulator or device. Then, open up the desktop version of Chrome, and navigate to chrome://inspect#devices. You should see a window that looks like this:

From here, you should see your emulator or device listed, and if you're lucky, the specific page you're looking at. Now you have simply to click "inspect" and you'll be on your way.
If you don't see your device or page, it could be for a few different reasons. First of all, emulators need to forward the remote debugging port to the host system so that desktop Chrome (which is running on the host system) can access that port in order to facilitate the inspection. So the first thing to try is the ADB command which forwards the appropriate port:
adb forward tcp:9222 localabstract:chrome_devtools_remote
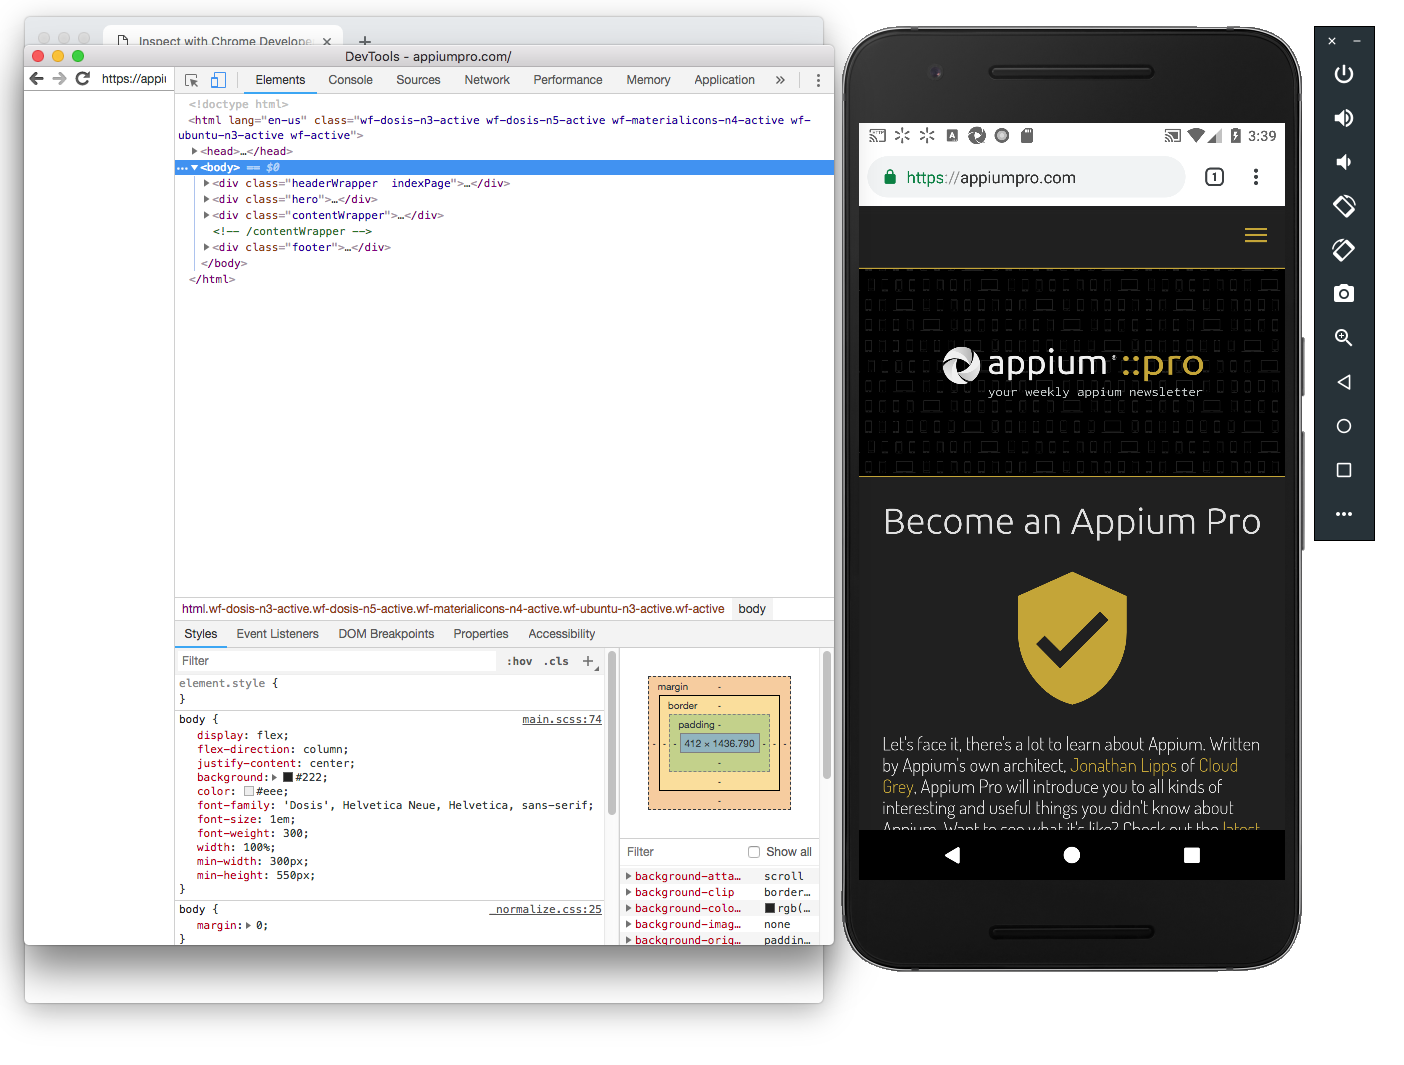
Running this command should get your device to pop up in the Inspect list. Now, once you've clicked "inspect", you'll again get a full-featured inspector window with all the developer tools your little robot heart fancies:

The only downside to the Chrome inspector is that hovering over elements in the HTML source does not highlight the corresponding element on the device screen. But anyway, you can use it in the same way I described above for Safari to determine your locator strategies and selectors.
For hybrid apps, you might not need to do anything else. If you have opened up your app, navigated to the view containing the webview, and see the webview contents in the Inspect window, then great! If not, it could be that the webview has not turned on debugging. For security, Android requires that each webview explicitly allows debugging, otherwise debugging via Chrome will not work.
As a convenient way of applying this setting to all webviews in your app, you (or your developer) can simply ensure that the following method is called on the WebView class:
WebView.setWebContentsDebuggingEnabled(true);
Re-compile your app, launch it, and you should now see your webview in a debuggable, inspectable state!
