
Edition 12
Capturing Performance Data for Native iOS Apps
As mobile app testing becomes more and more ubiquitous, the lines between different kinds of automated testing can become blurred. For example, performance testing is becoming an integral part of the development cycle. And for good reason---users of mobile apps have very low tolerance for poorly performing apps. We've already shown how it's possible to use Appium to collect performance metrics for Android apps, and we can do something very similar for iOS.
Performance testing for iOS apps involves the Instruments utility distributed by Apple alongside Xcode. Instruments comes with a number of built-in analyses and measurements. If you open it up, you're greeted with a list of these:
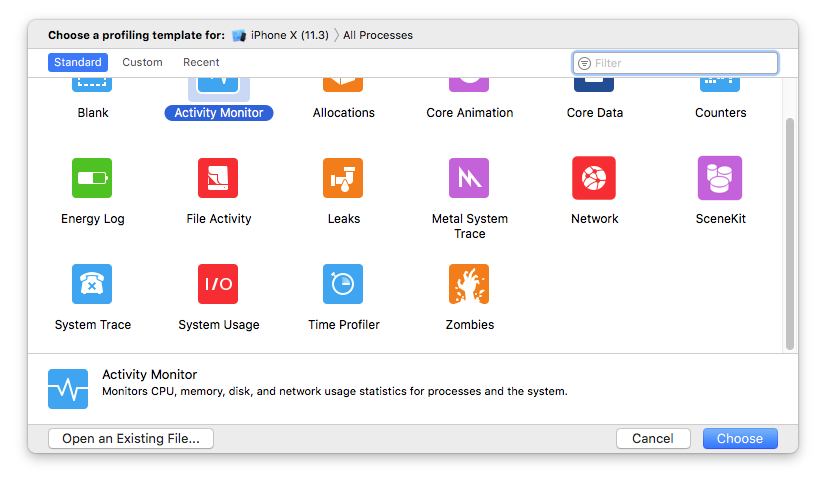
Essentially, these are the various performance measurements it will be possible to initiate using Appium, so keep an eye on this list for ideas about what you might want to measure for your app, and make sure to check out Apple's docs if you want to know more about what each of these do. For our purposes in this newsletter, we're going to choose the "Time Profiler" instrument. But since we're using Appium, we don't need to click on anything in the Instruments app itself. Instead, we'll head to our code editor!
The way iOS profiling works with Appium is with two commands: one to start the profiling and one to stop it and dump the data out to us for viewing. These commands are available as of Appium 1.8, via the mobile: command interface. Essentially, it's as simple as:
driver.executeScript("mobile: startPerfRecord", args);
// here: do some stuff in the app that you want to profile
String b64Zip = (String)driver.executeScript("mobile: stopPerfRecord", args);
// here: convert the base64-encoded zip file to actual file data on your system
We use the mobile: startPerfRecord and mobile: stopPerfRecord commands to signal to Appium when during our script we'd like the profiling to occur. There is one wrinkle, however: for any of this to work, we need to have started the Appium server with the --relaxed-security flag. This is because Instruments can gather data from the system as a whole, not just the AUT. (It's thus a security risk to expose potentially sensitive system information to Appium sessions running from a remote client, for example in the context of a cloud Appium host).
There's also another aspect of the snippet above that I haven't yet touched on: what about the args parameter to these methods? The "start" method takes an argument object with three fields, for example:
HashMap<String, Object> args = new HashMap<>();
args.put("pid", "current");
args.put("profileName", "Time Profiler");
args.put("timeout", 60000);
Here we have:
- Specified which process we want to attach to ("current" is a handy shortcut to refer to the AUT, which is probably what we're interested in. By default all processes will be profiled if we don't specify anything).
- Specified which kind of instrument we want to run (the Time Profiler).
- Specified a timeout (in milliseconds) after which the performance trace will stop on its own. These trace files can get pretty huge so this is an important parameter to remember.
For stopPerfRecord, the only argument we care about is profileName, which should have the same value as what we passed in to startPerfRecord, so Appium knows which of potentially multiple traces to stop. The other wrinkle here is the return value of stopPerfRecord; what's b64Zip supposed to mean? Well, what Appium is giving back to you when you stop performance recording is actually an Instruments Trace Document, which happens to be a directory under the hood. Since directories are impossible to send in string format, Appium zips up this .trace directory and hands it back to the client script in base64 encoding. To make use of this data, we have to decode it and dump it into a zipfile on our system, with code like the following:
File traceZip = new File("/path/to/trace.zip");
String b64Zip = (String)driver.executeScript("mobile: stopPerfRecord", args);
byte[] bytesZip = Base64.getMimeDecoder().decode(b64Zip);
FileOutputStream stream = new FileOutputStream(traceZip);
stream.write(bytesZip);
At this point, we'll have a nice little trace.zip sitting at the specified location on disk. We can now simply unzip it and double-click it to open the trace file up in the Instruments viewer:
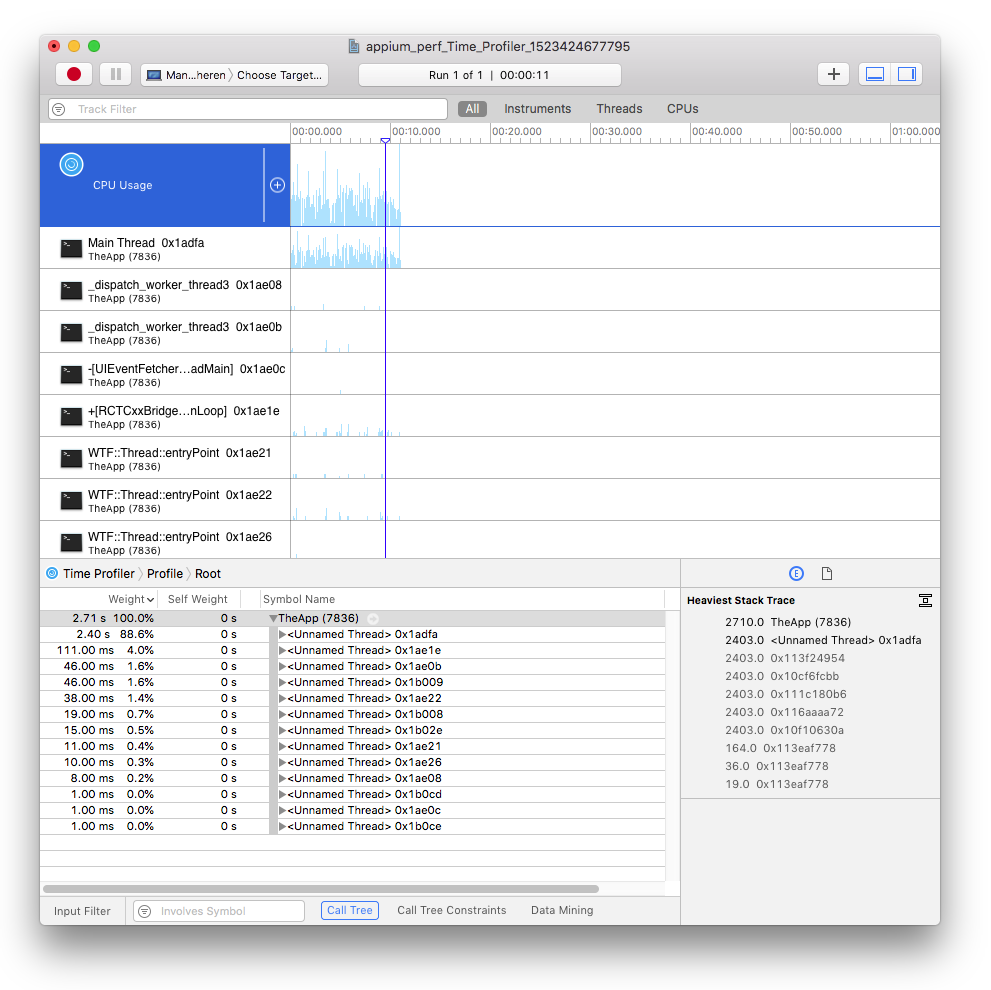
In this Instruments UI, we can dig through the various threads that were active during the profiled portion of our Appium test, and see which routines that thread spent most of its time in (via the stacktrace snapshots taken by the profiler). This can help us to find CPU-hungry areas of our app, which we might decide to offload to a worker thread to improve the user experience, for example. There are all kinds of considerations, and potential avenues of improvement based on the data gleaned from these trace files, but that is outside the scope of this brief tutorial. What's important today is that you've figured out how to capture the data!
Since a common use case might be to profile your app over time, you might consider attaching the zipped trace files to your test report in your CI system, so that if a test fails, you also have some juicy profile data that could help in remediating the test. (There's actually an easy way to send the zip file straight to an asset manager that supports HTTP uploads; check out the Appium XCUITest performance docs for more info).
For the sake of showing a full example, the following is a simple test which lifts the actual app behavior from a different edition of Appium Pro, and simply runs those steps a number of times while bracketed by performance recording. The zip file is then written to disk, just as above, where I can happily open up the report in Instruments.
import io.appium.java_client.MobileBy;
import io.appium.java_client.ios.IOSDriver;
import java.io.File;
import java.io.FileOutputStream;
import java.net.URL;
import java.util.Base64;
import java.util.HashMap;
import org.junit.Assert;
import org.junit.Test;
import org.openqa.selenium.By;
import org.openqa.selenium.remote.DesiredCapabilities;
import org.openqa.selenium.support.ui.ExpectedConditions;
import org.openqa.selenium.support.ui.WebDriverWait;
public class Edition012_iOS_Performance {
    private String APP = "https://github.com/cloudgrey-io/the-app/releases/download/v1.3.0/TheApp-v1.3.0.app.zip";
    private File traceZip;
    private By msgInput = By.xpath("//XCUIElementTypeTextField[@name=\"messageInput\"]");
    private By savedMsg = MobileBy.AccessibilityId("savedMessage");
    private By saveMsgBtn = MobileBy.AccessibilityId("messageSaveBtn");
    private By echoBox = MobileBy.AccessibilityId("Echo Box");
    private String TEST_MESSAGE = "Hello World";
    @Test
    public void testAppActivity() throws Exception {
        // Note: Appium server must have been started with --relaxed-security
        DesiredCapabilities capabilities = new DesiredCapabilities();
        capabilities.setCapability("platformName", "iOS");
        capabilities.setCapability("platformVersion", "11.3");
        capabilities.setCapability("deviceName", "iPhone X");
        capabilities.setCapability("app", APP);
        IOSDriver driver = new IOSDriver<>(new URL("http://localhost:4723/wd/hub"), capabilities);
        traceZip = new File("/path/to/trace.zip");
        try {
            HashMap<String, Object> args = new HashMap<>();
            args.put("timeout", 60000);
            args.put("pid", "current");
            args.put("profileName", "Time Profiler");
            driver.executeScript("mobile: startPerfRecord", args);
            performActions(driver);
            performActions(driver);
            performActions(driver);
            args = new HashMap<>();
            args.put("profileName", "Time Profiler");
            String b64Zip = (String)driver.executeScript("mobile: stopPerfRecord", args);
            byte[] bytesZip = Base64.getMimeDecoder().decode(b64Zip);
            FileOutputStream stream = new FileOutputStream(traceZip);
            stream.write(bytesZip);
        } finally {
            driver.quit();
        }
    }
    public void performActions(IOSDriver driver) {
        WebDriverWait wait = new WebDriverWait(driver, 10);
        wait.until(ExpectedConditions.presenceOfElementLocated(echoBox)).click();
        wait.until(ExpectedConditions.presenceOfElementLocated(msgInput)).sendKeys(TEST_MESSAGE);
        wait.until(ExpectedConditions.presenceOfElementLocated(saveMsgBtn)).click();
        String savedText = wait.until(ExpectedConditions.presenceOfElementLocated(savedMsg)).getText();
        Assert.assertEquals(savedText, TEST_MESSAGE);
        driver.navigate().back();
    }
}