
Edition 94
Using the Appium Events API
Ever wondered what goes on under the hood while Appium is starting up, say, an iOS session using the XCUITest driver? Sometimes this is a process that takes several minutes, and sometimes it only takes a handful of seconds. Having a look at the Appium logs can clear up this confusion (maybe you notice that the first time you run an iOS test with a new version of Appium, it spent time rebuilding WebDriverAgent--that makes sense).
Just looking at the logs doesn't necessarily tell you how long Appium spent within each zone of its startup routine, though. You could turn on timestamps in the logs (using --log-timestamp), but then you have to do a bunch of mental gymnastics to develop a picture of the startup flow over time.
Getting event data
For this reason, the Appium team developed something called the "Events API" (or sometimes the "Event Timings API"). Basically, the timestamps of various points of interest in the lifecycle of a session are logged automatically as "events", which can be retrieved at any point during the test.
Previously, it was possible to retrieve events using the getSessionDetails command:
Map<String, Object> details = driver.getSessionDetails();
Map<String, Object> events = details.get('events');
For this to work, you also had to use the eventTimings capability, and set it to true, in order for Appium to decorate the session details response with the appropriate timing information. However, in the W3C protocol there is no route that corresponds to getSessionDetails, and so the Appium team has added its own route, which is supported in the Java client as the getEvents command:
ServerEvents events = driver.getEvents();
Understanding event data
What you get back from this call is a ServerEvents object encapsulating the various types of data returned with this API. Let's take a look at the (truncated) raw API response for an example call, so you can see its shape:
{
  "commands": [
    {
      "cmd": "findElement",
      "startTime": 1573001594602,
      "endTime": 1573001594810
    },
    {
      "cmd": "getLogEvents",
      "startTime": 1573001599636,
      "endTime": 1573001599636
    }
  ],
  "xcodeDetailsRetrieved": [
    1573001580191
  ],
  "appConfigured": [
    1573001586967
  ],
  "resetStarted": [
    1573001586969
  ]
}
There are two main sections here, one labeled commands, and then a bunch of other names consisting of timestamps. All commands sent to the Appium server are considered events, and their start and end times are tracked. In addition, the hand-picked named events are included, for example xcodeDetailsRetrieved or appConfigured above. (In all cases, the numeric values are timestamps in milliseconds.)
The ServerEvents object for this reason has a commands field and an events field, each constituting a list of their own type (CommandEvent and ServerEvent) respectively, and containing the event name and timestamp(s).
Custom events
In addition to the hand-picked events automatically included by the Appium team, you can also tell the Appium server to include your own events within the event log, so that you can have a record of when actions within the world of your test logic took place with respect to the built-in Appium commands. To do this, you need to log the event:
CustomEvent evt = new CustomEvent();
evt.setVendorName("prefix");
evt.setEventName("eventName");
driver.logEvent(evt);
In the example above, we are logging an 'eventName' event with the vendor name 'prefix'. Why do we need this vendor prefix? To ensure that custom events can never conflict with built-in ones, or with events logged by another library. These custom events will show up when you call getEvents later on! Here are some that I triggered in a test of my application:
  ...
  "theapp:onLoginScreen": [
    1573001595285
  ],
  "theapp:testEnd": [
    1573001599630
  ]
  ...
If you want, you can use the Java client to write out the raw data in JSON format somewhere on disk for use with other applications, too:
// assume we have ServerEvents object 'events'
events.save(new File('/path/to/events.json').toPath());
With all of this raw data, you could build interesting visualizations of the time Appium spent in between each of these events. But you don't really need to, because the Appium team already built a tool to do this for you! It's called the Event Parser, and it's a CLI tool you install via NPM:
npm install -g appium-event-parser
You can use the Event Parser to generate a timeline of all the events that are described in a JSON file, for example. (Did you notice the save command above? It gets you exactly what you need to make this happen).
appium-event-parser -t -i /path/to/events.json
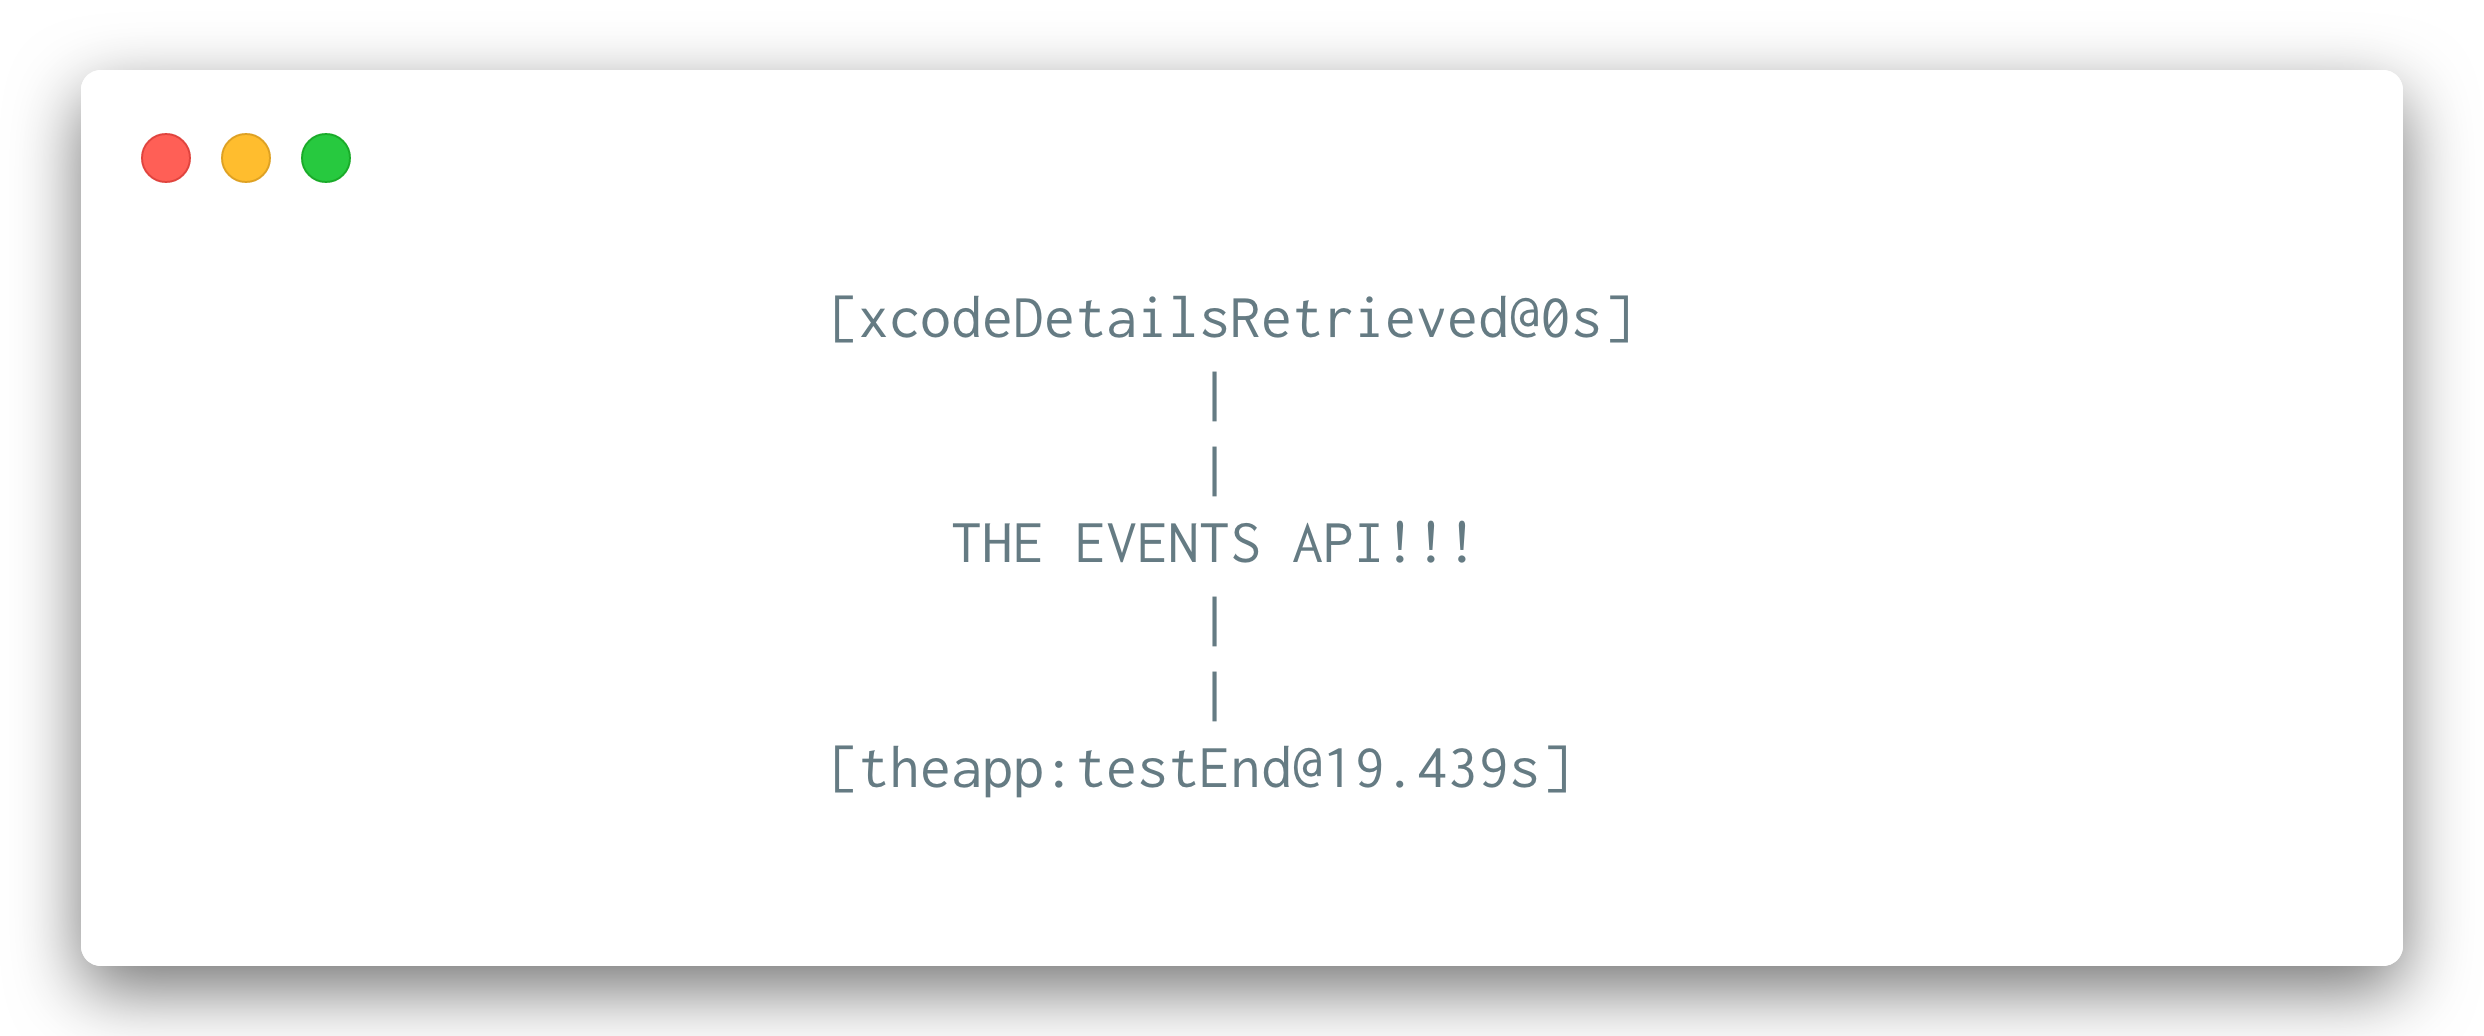
(The -i flag is followed by the path to the data file, and -t tells the program you want a timeline printed out. You can also pass an -l flag followed by a number to change the number of lines the timeline takes up). Once you run this command, you'll be greeted by a nice little timeline:
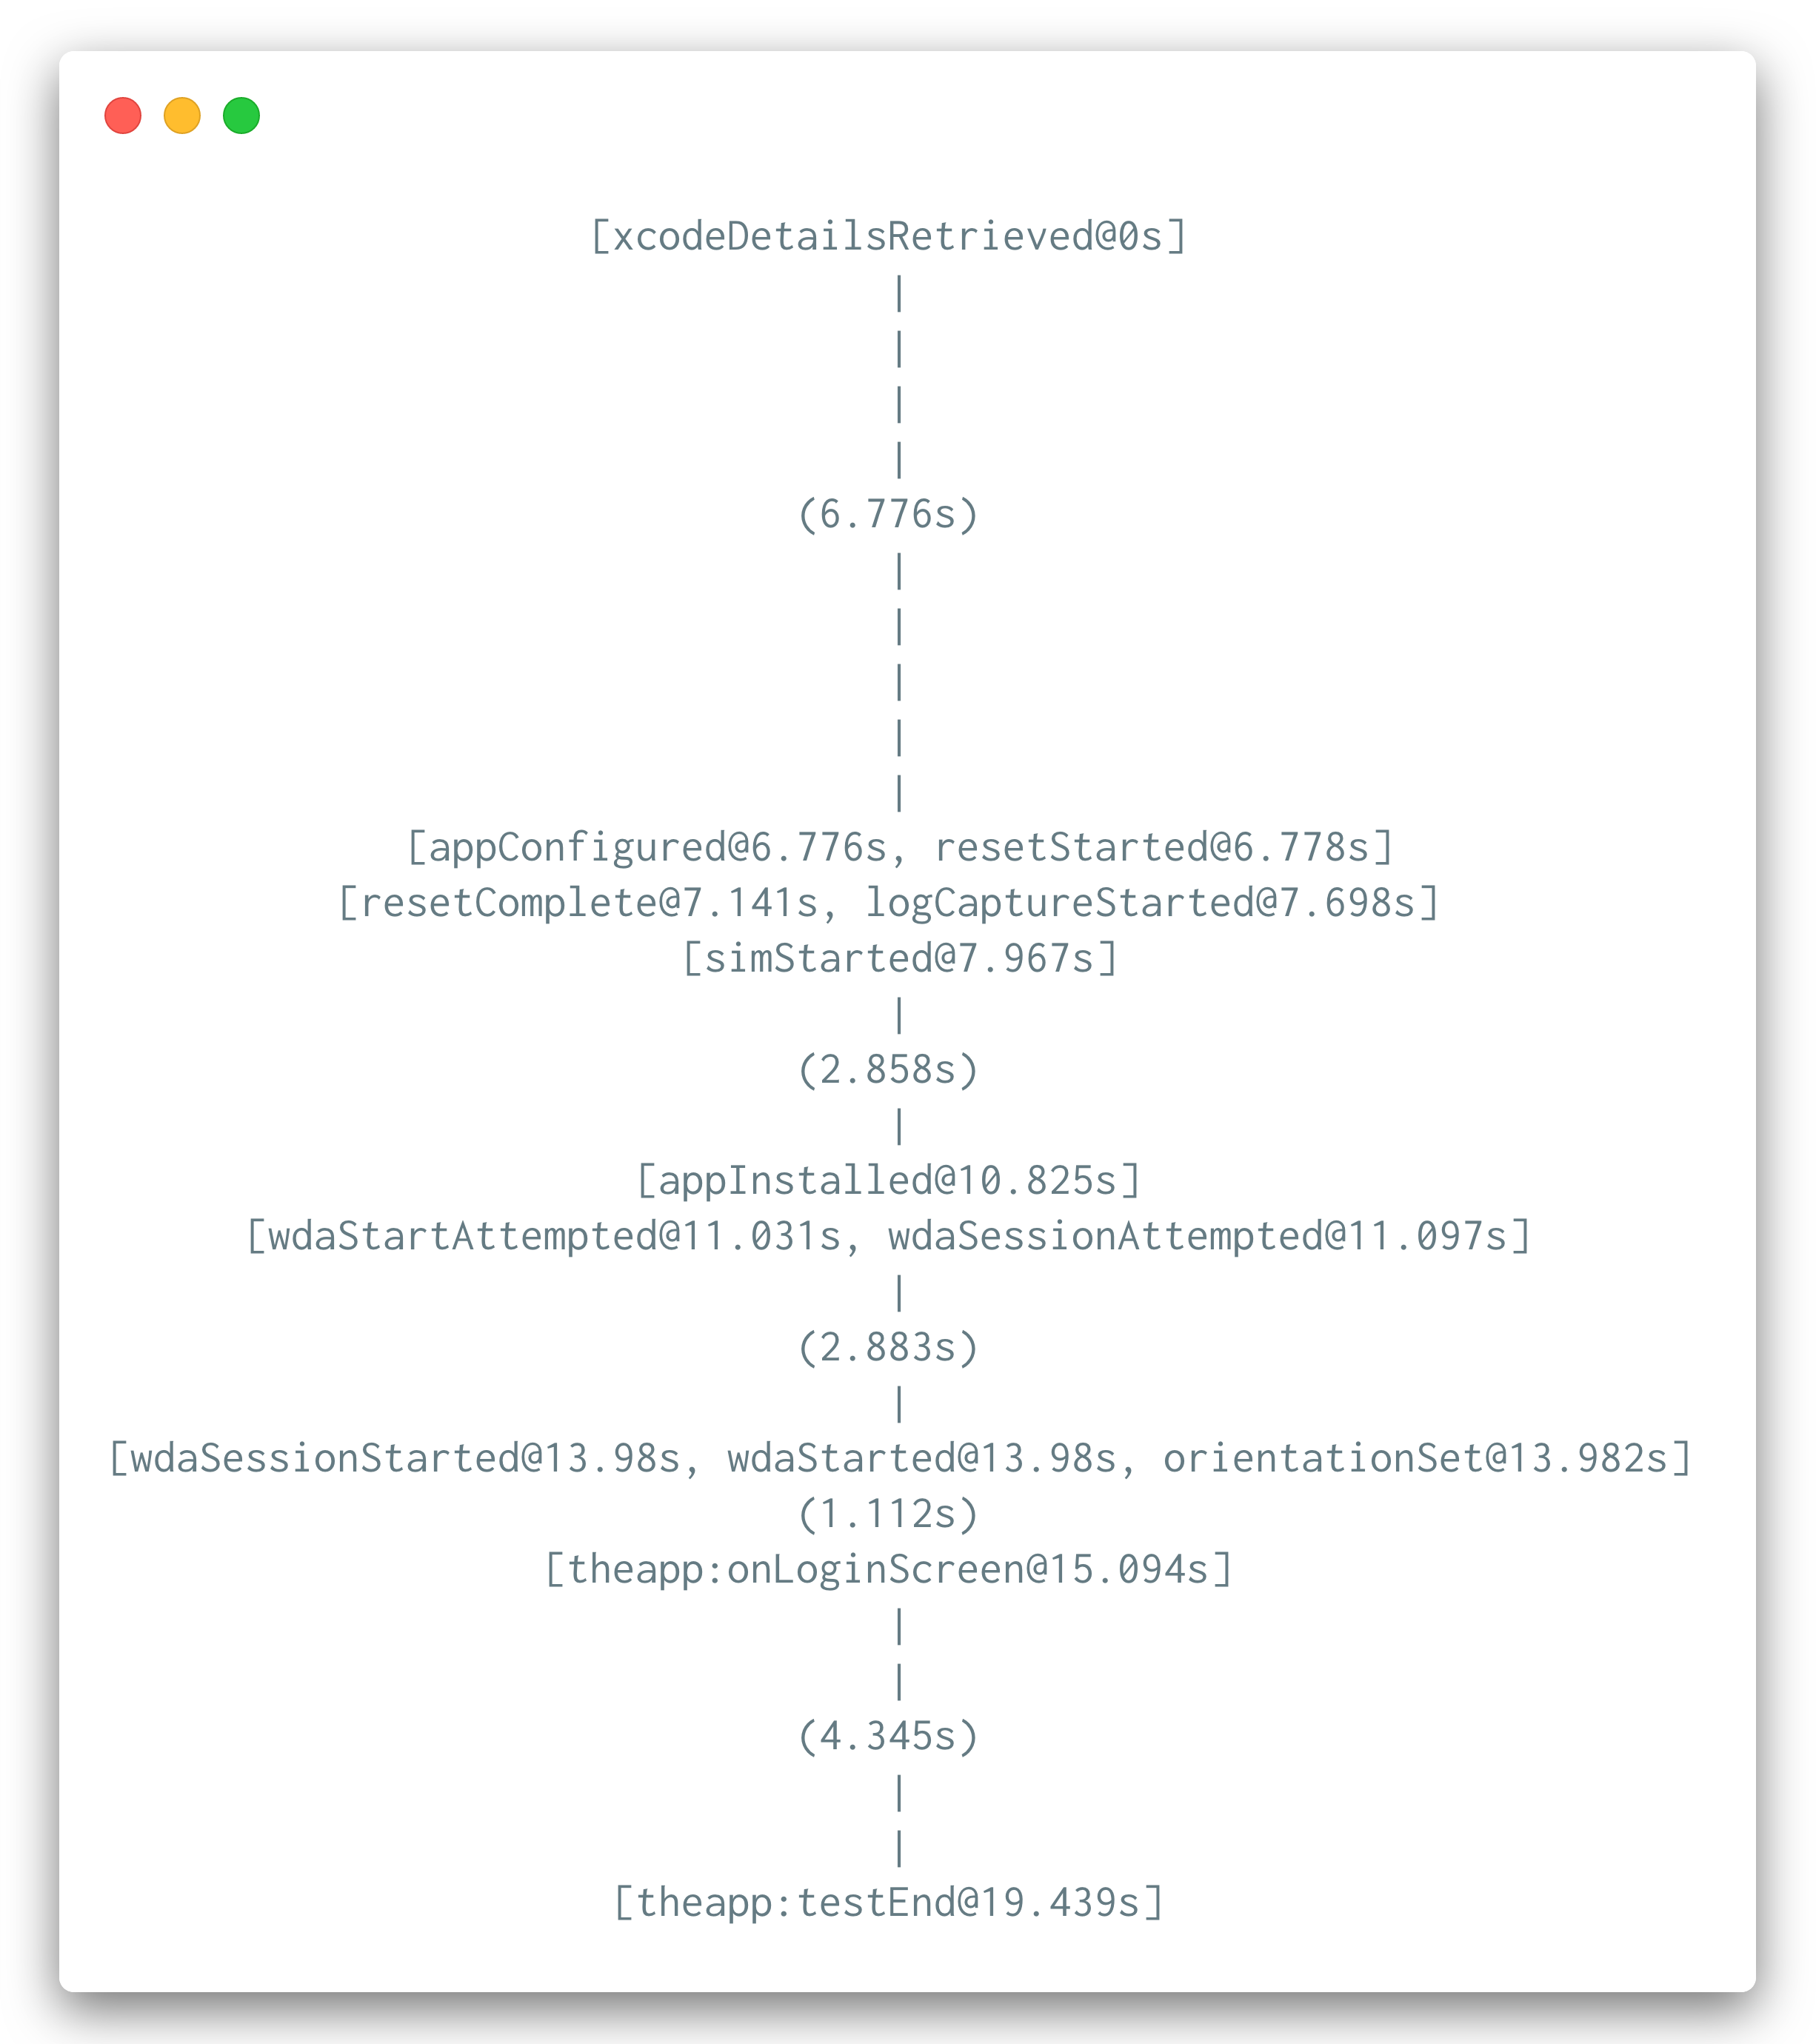
You can also check out a full sample test using these features! Let me know if you come up with any interesting use cases for this API; I'm sure there's some great possibilities out there.